

How Visual Dashboards Improve Team Accountability
Accountability within a team does not happen by default. It requires structure, visibility, and a shared understanding of who owns what. Progress tracking often still happens through scattered spreadsheets, lengthy emails, and verbal updates, making it harder to maintain clarity and accountability.
Visual dashboards address this gap by turning raw data into a format that teams can read and act on within seconds. When every member of a team can see the same metrics in real time, the dynamic around ownership and follow-through shifts. Work becomes visible, progress becomes measurable, and gaps become harder to ignore.
Here is how visual dashboards strengthen accountability across teams and why they work.
Making Progress Visible to the Entire Team
One of the primary ways dashboards drive accountability is through transparency. When task status, deadlines, and completion rates are displayed on a shared dashboard, every team member can see where things stand, without waiting for a meeting or chasing down updates. Tools like employee oversight software from WorkTime support this by giving managers a non-invasive view of team activity and productivity trends, so visibility does not come at the cost of employee trust.
This visibility serves two purposes:
- It removes ambiguity. There is no confusion about whether a task is in progress, blocked, or completed.
- It creates natural peer accountability. When progress is public, people are more likely to follow through on commitments because the work speaks for itself.
A Kanban-style board, for example, shows tasks moving through stages. If a task stays in the same column for too long, it signals a potential bottleneck that the team can address before it becomes a larger problem.
Assigning Clear Ownership to Every Metric
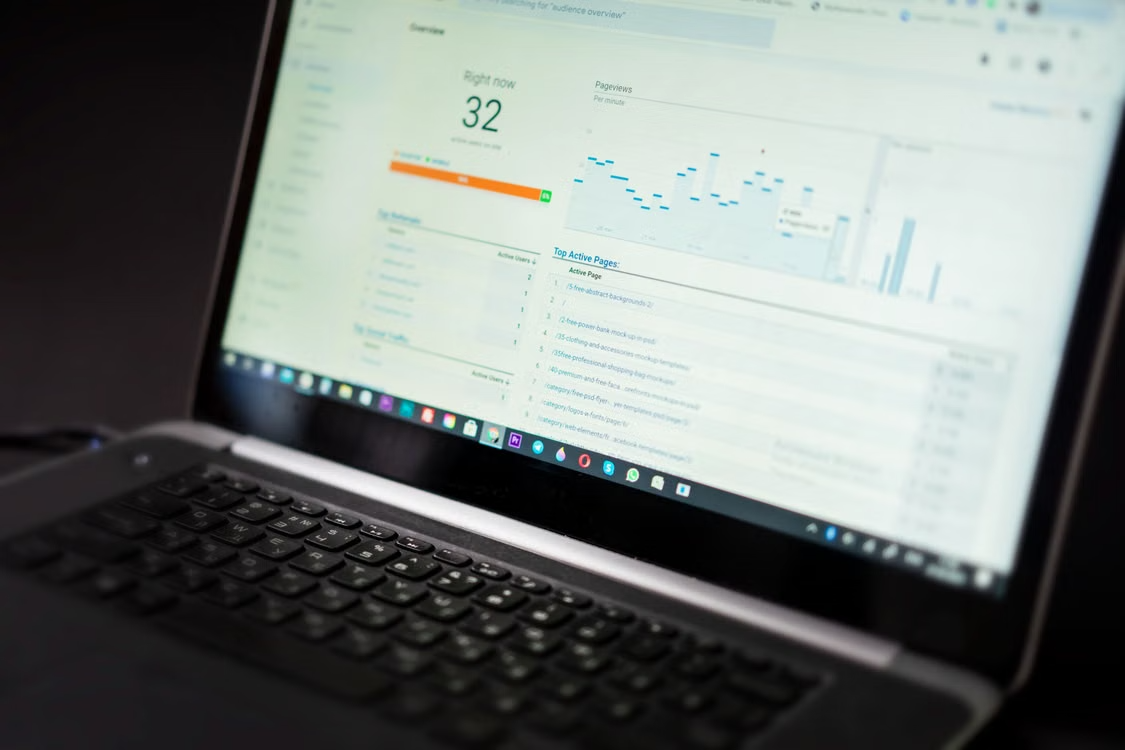
A dashboard without ownership is just a display. The difference between a useful dashboard and a decorative one is whether each metric has a name attached to it.
Effective dashboards assign responsibility at the metric level:
- Each KPI or task is tied to a specific person or team.
- Status indicators — such as green, yellow, or red markers — show whether that person’s area is on track or needs attention.
- Thresholds trigger review or escalation, so accountability is built into the system rather than left to subjective judgment.
This structure makes it clear who is responsible for what. When a metric turns red, the team does not need to spend time figuring out who should respond. The dashboard already answers that question.
Establishing a Consistent Review Rhythm
Dashboards are most effective when paired with a regular cadence of review. Without that rhythm, even well-designed dashboards become background noise.
Teams that use dashboards to drive accountability tend to follow a structure like this:
- Daily or weekly stand-ups where the dashboard is the focal point for discussion, not a side reference.
- Monthly reviews where department-level metrics are assessed against goals.
- Quarterly sessions where leadership evaluates whether execution is aligned with strategy.
This rhythm keeps the dashboard active and relevant. It also builds a habit of checking in on progress rather than waiting until a deadline passes to assess performance.
Turning Data Into Decisions, Not Just Reports
Many teams collect data but do little with it. Dashboards change this by presenting information in a way that prompts action.
When a team sees a progress bar stalling, a workload heatmap showing uneven distribution, or a trend line moving in the wrong direction, the next step becomes clear. The visual format reduces the time spent interpreting numbers and increases the time spent solving problems.
Key design principles that support this shift include:
- Keeping metrics focused. A dashboard with too many widgets creates noise. Each element should answer a specific question.
- Designing for quick scanning. Large numbers, simple charts, and color-coded indicators allow team members to assess status at a glance.
- Reserving alerts for what matters. Overusing red indicators leads to alert fatigue. Critical issues should stand out from routine updates.
Creating a Culture Where Accountability Is the Norm
Over time, dashboards do more than track performance. They shape how a team operates. When everyone works from the same information, accountability shifts from constant oversight to shared ownership.
Teams that maintain their dashboards consistently — updating data, rotating ownership of updates, and using the dashboard in decision-making— build a culture where follow-through is expected, not enforced. The dashboard becomes part of the workflow rather than an afterthought.
The result is a team that holds itself accountable because the system makes it easy to do so.