
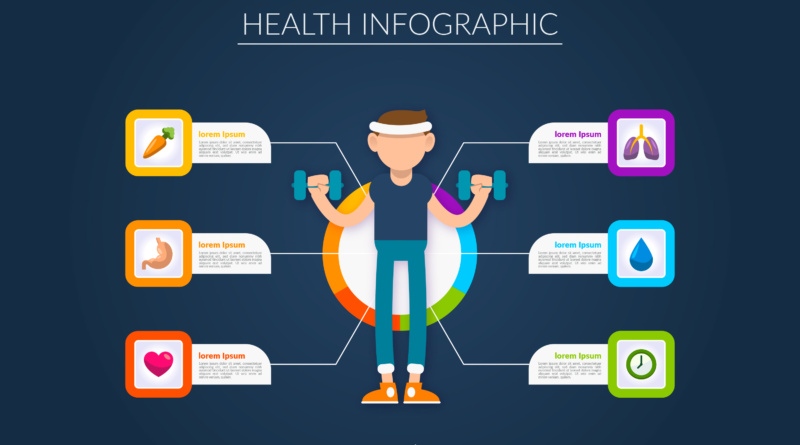
How to Design Health Infographics That Make Nutrition Advice Easier to Understand
A nutrition infographic should help someone make a food choice, not give them another puzzle to solve. After all, when serving sizes, nutrient amounts, and meal suggestions compete for attention, even accurate advice can become difficult to use.
Good design gives readers a clear starting point and a practical takeaway. Whether you are explaining food labels or illustrating a balanced meal, the goal is to make the information easier to understand without stripping away important context.
Choose One Message
Start by deciding what readers should understand or do after viewing the infographic. A focused message gives every illustration, number, and caption a clear purpose.
“Understand the serving size before comparing labels” is more useful than a broad topic such as “eat better.” The narrower message helps you decide what belongs on the page and what should move into a separate resource.
Write that takeaway before opening your design software. Then review each proposed element against it: does the information help explain the main point, or does it introduce another lesson?
Or maybe you want to provide nutrition resources for losing weight.
For instance, you may want to let your audience know they can get one-on-one weight management advice from dietitians via Weight Watchers for as low as $0 with most insurance.
Whatever your message is, a focused infographic can provide valuable advice. But it shouldn’t try to cover an entire topic.
Build a Clear Reading Path
Arrange information in the order readers need it, rather than the order you collected it. Put the main takeaway first, followed by the explanation and a practical example.
Use size, spacing, and alignment to make those levels obvious. A reader should not need to guess whether a large decorative number matters more than the instruction beside it.
Before adding decorative details, establish three visual priorities:
- A headline that states the main message
- A central visual that explains the idea
- A takeaway that suggests a practical next step
Keep related labels and images close together. If readers must repeatedly scan across the page to match a caption with its illustration, simplify the layout.
Translate Nutrition Numbers Into Familiar Comparisons
Give numbers enough context to mean something. An isolated nutrient amount, for instance, could leave readers wondering whether it describes one serving, an entire package, or a different quantity.
You should pair numbers with clear explanations rather than expecting readers to interpret figures alone.
When comparing foods, use the same measurement basis and label clearly. Otherwise, differences in things like serving size can make a comparison misleading.
Place units beside their numbers and explain unfamiliar terms where they appear. And avoid making readers search through footnotes for information that is essential to understanding the graphic.
Use Images That Explain the Advice
Choose illustrations that teach rather than simply decorate. A food image earns its space when it clarifies a quantity, shows a comparison, or demonstrates an action.
For example, a serving-size illustration should show the relevant food and measurement together. A generic photograph of groceries may look appealing without helping readers understand the lesson.
Research on dietary guideline infographics published by Sage Journals found that design preferences varied across age groups. So, consider whether your audience will recognize the foods, symbols, and presentation style you choose for your design.
Show culturally familiar options where appropriate. And keep image sizes consistent when comparing amounts so that visual scale does not accidentally exaggerate a difference.
Make Every Word and Color Easy to Read
Use everyday wording without changing the meaning of the nutrition advice. Explain necessary technical terms briefly, and replace long introductions with direct labels.
Accessible communication and thoughtful visual presentation matter. So, apply that approach by treating wording and layout as parts of the same explanation.
Use color to organize information, but pair it with words or recognizable symbols. Readers should still understand the message if they cannot distinguish two colors.
Check your infographic at its intended viewing size. Labels that look comfortable on a large design canvas may become difficult to read in a phone-sized image or printed handout.
Test the Design With Your Intended Audience
Ask people from the intended audience to review an early draft. Their interpretation matters more than whether they describe the design as attractive.
Start with open-ended questions about the message, the numbers, and the action they would take. Avoid explaining the infographic first, since your explanation can hide problems in the design.
Watch for repeated misunderstandings, then revise the relevant wording or visuals. If several readers mistake the package amount for the serving amount, for example, make that distinction more prominent.
Finally, check the underlying nutrition information and its source dates. Have a qualified nutrition professional review health-related claims when needed, especially if simplifying them could change their meaning.
Helping Readers Put Nutrition Advice Into Practice
Effective health infographics give readers a focused message, understandable comparisons, and an obvious reading path. Familiar images, readable labels, and audience feedback help turn that message into something people can use.
Before publishing, check whether someone can explain the takeaway without your help. If the answer is unclear, simplify the design rather than adding another paragraph.
Was this post helpful? If so, explore some of our other insightful content.