How To Visualize Sensitive Topics in Online Media
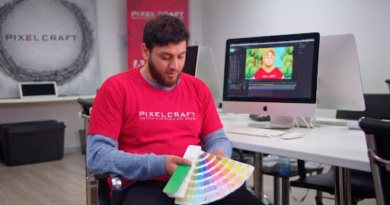
When people picture design, they judge the entire career path based on what they see. “It’s nice.” “It’s not nice,” but almost never do people think, “This wasn’t easy to do,” or “This took some really creative and intelligent thinking to create.” One aspect of design is visualizing tough topics
Read more